Lovegrove Mathematicals
"Dedicated to making Likelinesses the entity of prime interest"
Lovegrove Mathematicals
"Dedicated to making Likelinesses the entity of prime interest"

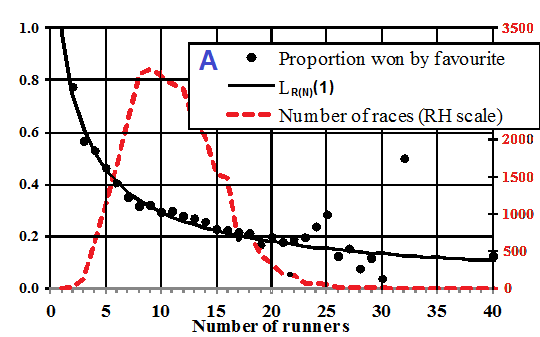
The results of 30,000 UK horse races were collected, taking the results from various newspapers, teletext and web sites. The proportion of races won by the Favourite is compared with LR(N)(1) in Figure A, where N is the number of runners.

Odds, and therefore (to a lesser extent) ranking, are not constants used by everyone. They are set by individual turf accountants, who are in competition with one-another and will compete by offering different odds. The data, by being taken from different sources, therefore represents averages over not only different races but also different turf accountants.
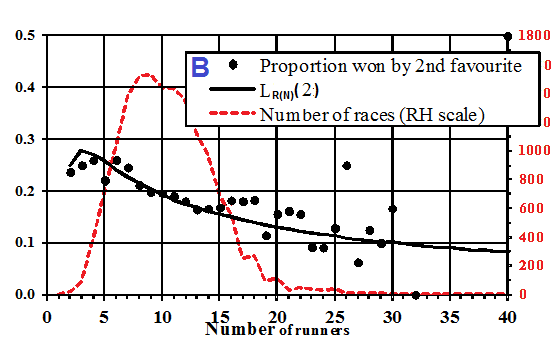
Not all of the sources used to provide the horse-race data indicated whether or not a race had been won by the second favourite. Those that did accounted for approximately half (15,160) of the 30,000 results collected. For those 15,160 races, the proportion won by the second favourite is compared with LR(N)(2) in Figure B

LR(N)(i), viewed as a function of N, is strictly decreasing only when i=1. In the case of second favourites (i=2), we have LR(3)(2)=0.28>0.25=LR(2)(2), so the second favourite is on average more likely to win if there are 3 runners than if there are 2.